Showing posts with label EMC. Show all posts

Nov 11, 2015

EMC Networker Fundamental - EMC Networker 9


The three primary types of NetWorker hosts in a NetWorker Data Zone are the NetWorker server, storage node(s), and clients.
A single NetWorker server, along with its storage nodes and clients, forms a NetWorker Data Zone within which data is protected.
An enterprise may have more than one NetWorker data zone, however, NetWorker servers and storage nodes may belong to only one data zone.
NetWorker clients may be backed up by multiple NetWorker servers and therefore, may belong to multiple data zones.
Additionally, NetWorker provides the ability to create multiple restricted data zones (RDZ) on a single NetWorker server to support multi-tenancy requirements of organizations like IT service providers and cloud hosting providers


The NetWorker Client is the largest and most fundamental NetWorker software component. The client’s most important functions are to generate backups called save sets, push them to a NetWorker storage node, and retrieve them during a recovery. NetWorker clients are usually the data servers in an IT environment. The types of data that are typically backed up as save sets include file system data and applications.
While performing a backup, the client also generates tracking information, including the file and directory names in the backup and the time of the backup, and sends it to the server to facilitate browsable Point In Time (PIT) recoveries.
Depending on the specific operating system, the client software may contain graphical user interfaces and command line utilities that allow users to manually perform backup and recovery operations.
Every host in a NetWorker data zone is a NetWorker client. NetWorker client software is installed on all participating hosts in the data zone, including hosts that also play the roles of server and storage node.


NetWorker Storage Nodes are hosts with directly-attached or SAN/LAN-accessible devices to support the storage of backup data.
During a backup, a NetWorker client sends backup data to a particular storage node based on that client’s configuration. The storage node organizes the client’s data and writes the client’s data to one of its devices.
Storage nodes also send tracking information about the save sets written to the volume during the backup to the NetWorker server. This information is used for future backups as well as for recoveries.
During a recovery, the client reads from the storage node. The storage node provides the device that contains the necessary volume.
The NetWorker server is always a storage node and is the default storage node for backups. A NetWorker server can manage many storage nodes, but a NetWorker storage node can be managed by only one NetWorker server. In other words, a storage node cannot exist in two data zones at the same time. Storage node hosts have both the NetWorker client and storage node software installed


The NetWorker Server manages and supports client backups and recoveries. It is the data zone host that stores the configuration information, such as client configurations, devices, and scheduling information. The NetWorker server also stores the online NetWorker databases that track the backups and volumes. As a client within the data zone, the NetWorker server automatically backs up the configuration and tracking databases to protect NetWorker data. There is a single NetWorker server per data zone and it must be available for any NetWorker activity to be supported in that data zone. The NetWorker server has the NetWorker client, storage node and server software installed.


Administration of a NetWorker server is performed using the NetWorker Management Console Server (NMC), commonly referred to as the console server. It is a Java-based graphical user interface accessible from any supported web browser. The console server provides a global view of the NetWorker environment, allowing you to centrally configure and manage one or more NetWorker data zones. The console server gathers information about backups from multiple data zones. The console server can prepare a number of preconfigured reports generated using information gathered from any or all of the NetWorker servers. Detailed customized reports can also be created. The NMC server is most often run on the same host as the NetWorker server, however, it can be run on a dedicated host. This is the preferred configuration in larger, busy environments.

NetWorker control data collectively represents the NetWorker configuration information and the backup tracking information stored on the NetWorker server.
The Resource Directory, also known as the resource database, is the directory that contains the configuration resource files.
The Media Database is the NetWorker database used to track the backups and the volumes they are stored on.
Client File Indexes, or CFIs, are the NetWorker databases that track each file or pathname in a client’s backup, allowing clients to browse their backups for files from a particular point in time. The NetWorker server creates and maintains one client file index per client.


Resources are configurable objects used to configure a NetWorker environment.
Each configurable component in NetWorker is represented by a resource and there can be multiple configurations for each type. Examples of resource types include clients, devices, tape libraries, backup start times, and policies.
Nearly all NetWorker resources are stored on and managed by the NetWorker server in the resource 
database 

Useful Link


Jul 24, 2015

EMC - VNX2 - Storage Analytics for VNX


EMC VNX VNX2 Technical Update - Deep Dive
Overview Link

Virtual VNX: Overview, Architecture & Use Cases

VNX Overview

Vnx series-technical-review

EMC VNX Unified Best Practices For Performance:Applied Best Practices Guide

NAS Meets SAN – an intro to VNX Unified

EMC VNX Monitoring and Reporting

EMC Storage Analytics for VNX includes a storage-only version of VMware vCenter Operations Manager and the EMC Adapter. The EMC Adapter collects storage performance and capacity metrics from VNX File and Block, and creates three custom dashboards:
  •  Storage Topology
  •  Storage Metrics
  •  VNX Overview
The adapter can be installed on the storage-only version of VMware vCenter Operations Manager or plugged in to your existing VMware vCenter Operations Manager environment. EMC Storage Analytics for VNX delivers actionable performance analysis and enables customers to quickly identify and resolve performance and capacity issues for VNX series systems in virtual and physical environments. Other benefits include the ability to:
  •  Simplify storage operations management with powerful visualization and topology views
  •  Proactively optimize storage performance and efficiency across physical and virtual environments with deep storage analytics and dynamic thresholding
  •  Maintain service levels by quickly troubleshooting performance abnormalities and immediately remediating errors

Launch EMC Storage Analytics
The last EMC monitoring solution you will be exploring is EMC Storage Analytics (ESA). ESA leverages VMware vCenter Operations Manager to proactively monitor storage performance and efficiency across physical and virtual environments. For customer environments that utilize VNX systems as back-end storage for their VMware infrastructure, ESA collects performance and capacity data for storage analysis. In addition, it can be used in troubleshooting system abnormalities or in forecasting for future storage needs. Login to EMC Storage Analytics
  • 1. On your Windows Desktop, launch the Internet Explorer shortcut labeled EMC Storage Analytics
  • 2. When a certificate error appears when you navigate to EMC Storage Analytics, click Continue to this website


Getting to Manage Adapter Instances window
The VNX File and VNX Block each require an adapter instance. For VNX Block, only a single Storage Processor Adapter instance is required for each array. In the Storage System Selector, you can see that the VNX-Block and VNX-File systems have already been added to EMC Storage Analytics.
For users to traverse health trees from the virtual environment into the storage environment, EMC Storage Analytics maps LUNs from the storage system to datastores mounted on the ESXi server. To create these maps, EMC Storage Analytics uses the VMware vSphere connection type defined for the EMC Adapter.

  • 1. Hover over Environment
  • 2. Hover over Configuration in the drop down
  • 3. Click Adapter Instances...


Adding a vCenter Adapter Instance
You will now add the vCenter Adapter Instance.
  • 1. In the Manage Adapter Instances window, select the following values:
• Collector: vCenter Operations Standard Server
• Adapter Kind: EMC Adapter
  • 2. Click Add New Adapter Instance button


Storage Topology
The EMC Storage Topology dashboard provides a view of VNX resources and relationships between storage and virtual objects.

  • 1. Click on the Storage Topology dashboards you can see in the Storage System Selector widget, you should see the VNX-File, VNX-Block, and vCenter instances When the health state icons are GREEN, it indicates that the instances are in good health. This is true in our case.
  • 2. In the Storage System Selector widget, click on VNX-File entry
  • 3. In the Storage Topology And Health widget, notice that a health tree appears The Health Tree widget provides a navigateable visualization of VNX resources and virtual infrastructure resources. You can single-click to select resources, or double-click a specific resource to view its relationship to other resources. You want to explore what disk volumes in your VNX system are being used for the Sales file system


EMC Storage Metrics
The EMC Storage Metrics dashboard shows resource and metrics for VNX systems; users can view graphs of resource metrics from the widgets in this dashboard.

  • 1. Click on the Storage Metrics dashboard
  • 2. In the Storage System Selector widget, highlight the VNX-Block entry
  • 3. In the Resource Selector widget, ensure the Image Map Tooltip button is selected


Demo LUN
Now, let’s take a look at how much storage was used to create the Demo LUN.

  • 1. In the Resource Selector widget, single-click the Demo resource
  • 2. In the Metric Selector widget, expand Capacity
  • 3. Double-click User Capacity (GB)
  • 4. View the graphical representation of the selected metric displayed in the Metric Graph widget

Here, you see that the Demo LUN has a size of 35 GB.

  • 5. Remove the graph by clicking the Close button at the top-right of the graph


EMC - VNX2 - Unisphere Remote

Unisphere Remote is a centralized and easy-to-use application that centrally monitors VNX and VNXe systems.
Unisphere Remote enables you to:
  • • Monitor hundreds of VNX and VNXe systems from a single interface
  • • View aggregated alerts, capacity, CPU usage, and the health of multiple systems
  • • Control access to the monitoring interface by setting up local Unisphere Remote users or integrating existing Lightweight Directory Access Protocol (LDAP) enabled users and groups
  • • Organize logical views of the VNX and VNXe nodes (e.g. by location, type, or department)
  • • Launch Unisphere for individual VNX and VNXe systems
The Unisphere Remote environment consists of a Unisphere Remote server running in a VMware virtualized environment, multiple VNX and/or VNXe systems, and a remote system to access the Unisphere Remote server
Latest release of Unisphere Remote, it has been renamed Unisphere Central

Open Management Settings
  • 1. Hover over the Settings tab from the top menu bar
  • 2. Click Management Settings


Configure Network Settings

  • 1. Select the Network tab to configure NTP and DNS settings
  • 2. In the Time Servers (NTP ) section, select the IP Address radio button and type in 192.168.1.10 and click Add
  • 3. In the DNS Servers section, type in 192.168.1.10 for the DNS Server and type vlab.local for the Domain Name and click Add
  • 4. Click Apply Changes when done


Add a Storage System
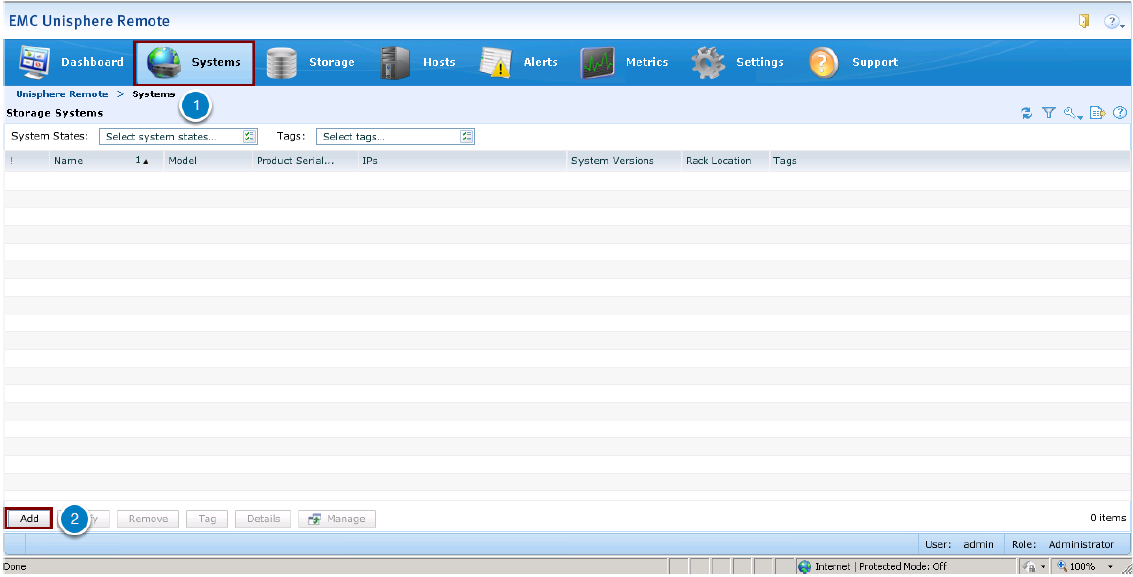
This section details adding a storage system to Unisphere Remote for monitoring. Multiple systems can be administered from this one console by adding them to Unisphere Remote. Configure the VNX2 to be Monitored

  • 1. Click the Systems tab
  • 2. Click Add to add a new storage system to be monitored by Unisphere Remote


Customize Link

  • 1. Click on the Dashboard tab
  • 2. Click the Customize link
  • 3. The Dashboard tab can be configured to display multiple dashboards containing any combination of widgets.

These widgets include:

  • • Alerts
  • • Systems List
  • • Capacity
  • • Systems Available Size
  • • Pools Available Size
  • • Metrics Storage


Alerting
The Alerts tab provides a list of storage system issues that you can resolve by performing the steps provided by the alert. You can use alerts to determine the cause of an issue, symptoms of an issue, and the actions that you can take to resolve it. The Alerts tab displays the following information for each alert:

  • • Severity
  • • Time
  • • Source
  • • Type
  • • Message

Note that the alerts listed are intentionally inserted into this lab for demonstration purposes.
Navigate to the Alerts Tab

  • 1. Click the Alerts tab from the top menu bar. You can see a list of alerts for the monitored systems
  • 2. Select one of the alerts in the list
  • 3. View the description in the Alert Information section at the bottom of the page where you can see details of the alert and any recommended actions


View Storage System Details Page
The Storage System Details page contains two sections. The top half of the page contains system details and capacity usage. The details include:

  • • System State
  • • Name
  • • Model
  • • Block Software Version
  • • File Software Version
  • • Tags

There is also a pie chart showing the current storage utilization of the specific storage system


EMC - VNX2 - VNX Monitoring and Reporting

1. Overview
VNX Monitoring and Reporting is a software solution that extends Unisphere for VNX capabilities by providing unified performance and capacity trending information of VNX storage systems. This solution complements Unisphere's health alerts and Analyzer archive files in order to improve the efficiency of your storage environment.
VNX Monitoring and Reporting automatically collects Block and File storage statistics along with configuration data and stores them in a database that can be viewed through dashboards and reports. This solution can retrieve information from one or several VNX storage systems, including legacy CLARiiON and Celerra systems, that are qualified for support. VNX Monitoring and Reporting is a versatile solution to help you understand storage utilization and workload patterns for problem diagnosis, trend analysis, and capacity planning

2. Hand-on Lab
Add a Storage System
The Adding a System page is where you specify the information required for VNX Monitoring and Reporting to access your storage system. You need to specify a unique name that will be used to identify this storage system and type of data collection; Unified, Block, or File. Unified data applies to integrated systems that contain both block storage (SAN) and file storage (NAS) hardware components. Legacy CLARiiON CX4 and Celerra NS systems that are supported can be added here as well

Adding a VNX System
  • 1. Click the Add New node to view the fields needed to add a storage system
  • 2. The Adding a System page displays the system information to be entered. Notice that the mandatory fields are indicated with a red asterisk


Reporting
Now that the VNX has been added to VNX Monitoring and Reporting, storage statistics and configuration data can be collected. VNX Monitoring and Reporting stores this information in a database that can be viewed through dashboards and reports.
  • 1. To view the reports, click Open Reporting Interface


Report Tree
On the left panel of the main page is a report tree where reports are organized into parent and child relationships. The report tree is a dynamic hierarchical tree used to navigate between nodes. You can browse the tree by clicking each entry; reports are generated and displayed in the main page.
  • 1. In the report tree, expand Systems > Summary > System Summary
  • 2. Under System Summary, select the Block entry representing your VNX system
  • 3. In the List of arrays section, click the entry for VNX5400


View Different Metrics
The main page displays a summary of the storage system components and statistics. As you scroll down this page, you can see that statistics are displayed in the form of charts, graphs, and lists.
  • 1. Observe the different types of system data collected


Analyze Read/Write Throughput and Bandwidth
VNX Monitoring and Reporting allows users to “drill-down” to underlying reports to get more detailed views of a selected component. Let’s take a look at the write performance of this VNX system. Note that your graphs may look different than the screenshots.
  • 1. Scroll down to analyze the Read/Write IOPS (IO/s) and Read/Write Bandwidth (MB/s) graphs
  • 2. In the Read/Write IOPS (IO/s) graph, hover your mouse over the Write IOPS line. Tracing the Write IOPS line willdisplay different IO values and timestamps of when the IO values were recorded


Analyze Storage Utilization
Let’s analyze the storage utilization of the VNX system.
  • 1. In the Block Usable Capacity (TB ) section, click the free space portion of the pie chart


View LUN Capacity
Scroll down to the LUNs Current Performance section to find the Demo LUN and view its capacity utilization. Click the entry for the Demo LUN.


EMC VNX VNX2 Technical Update - Deep Dive
Overview Link

Virtual VNX: Overview, Architecture & Use Cases

VNX Overview

Vnx series-technical-review

EMC VNX Unified Best Practices For Performance:Applied Best Practices Guide

NAS Meets SAN – an intro to VNX Unified

EMC VNX Monitoring and Reporting

Jul 23, 2015

EMC - VNX2 - How DataMover Failover

..

The failover process consists of a Primary Data Mover failing and a designated Standby Data Mover being activated as a spare to take the Primary’s place. If a Primary Data Mover becomes unavailable, the Standby assumes the MAC and IP addresses of the Primary Data Mover and provides seamless and uninterrupted access to its file systems.
Creating a Standby Data Mover ensures continuous access to file systems. When a Primary Data Mover fails over to a Standby, the Standby Data Mover assumes the identity and functions of the failed Data Mover.
To act as a Standby server, a Data Mover must first be configured as a Standby for one or more Primary Data Movers. For example, you can have one Standby Data Mover acting as a Standby for three other active Data Movers. If one of the Primary Data Movers fails over, the Standby Data Mover assumes the IP and MAC addresses and functions of the failed Data Mover. The former Standby is now a Primary and is no longer available in a Standby capacity.
The Standby Data Mover must have the same type of network interface cards (NICs) as the Data Mover with which it is associated. Any FTP, archive, or Network Data Management Protocol (NDMP) sessions that are active when the failure occurs are automatically disconnected and must be manually restarted.


To detect a Data Mover failure, the Control Station monitors the various conditions of all Data Movers through the redundant internal networks that connect the Control Station to each Data Mover. If the Control Station detects a failure, it responds according to the policy type established when the Standby relationship was created. If the problem persists, and if CallHome or Email Home is configured, the Control Station calls EMC Customer Service or your service provider with a notification of the event and diagnostic information. Note: If the Control Station is not running, Data Mover failover cannot occur. When the Control Station returns to service, it will recognize the Data Mover failure and initiate the appropriate action depending on the automatic, retry, or manual failover policy

When any failover condition occurs, you can transfer functionality from the Primary to the standby Data Mover without disrupting the availability of the file system. The standby Data Mover assumes the following identities from the faulted Data Mover:
  • •Network identity — IP and MAC addresses of all its NICs
  • •Storage identity — File systems controlled by the faulted Data Mover
  • •Service identity — Shares and exports controlled by the faulted Data Mover The Standby Data Mover assumes user file system services (if the policy is set to automatic) within a few seconds of the failure, transparently, and without requiring users to unmount and remount the file system. The definition of failover is the process of immediately routing data to an alternate data path or device to avoid interrupting services in the event of a failure. 
The impact to service is dependent on the application’s ability to handle the change gracefully. During normal operation, the VNX Control Station continually monitors the status of all Data Movers. If a Primary Data Mover fails, the Control Station detects the failure via the NAS Master Control Daemon communication over the dedicated network. It instructs the Standby Data Mover to take over as Primary while forcing the original Primary, if it is still running, into a failed state. Once failover is enacted, the Standby Data Mover becomes the Primary and resumes the entire identity of the failed Data Mover. In most cases, this process should have little, or no noticeable effect on user access to data. The Data Mover failover process works the same way in systems with two Control Stations. In the event of a Primary Control Station failure the Standby Control Station assumes the Primary role and it is responsible for the Data Mover failover. ..


EMC VNX VNX2 Technical Update - Deep Dive
Overview Link

Virtual VNX: Overview, Architecture & Use Cases

VNX Overview

Vnx series-technical-review

EMC VNX Unified Best Practices For Performance:Applied Best Practices Guide

NAS Meets SAN – an intro to VNX Unified

EMC VNX Monitoring and Reporting

EMC - VNX2 - Snapsure

1. Usefull Link


2. Overview


SnapSure is a VNX for File feature that saves disk space and time by creating a point-in-time view of a file system. This logical view is called a checkpoint and can be mounted as a read-only file system. SnapSure is mainly used by low-activity, read-only applications such as backups and file system restores.
SnapSure is not a discrete copy product and does not maintain a mirror relationship between source and target volumes. It maintains pointers to track changes to the primary file system and reads data from either the primary file system or from a specified copy area. The copy area is referred to as a SavVol, and is defined as a VNX for File metavolume.


SnapSure checkpoints provide users with multiple point-in-time views of their data. In the illustration above the user’s live, production data is a business proposal Microsoft Word document. If they need to access what that file looked like on previous days, they can easily access read-only versions of that file as viewed from different times. This can be useful for restoring lost files or simply for checking what the data looked like previously. In this example, checkpoints were taken on each day of the week


PFS

  • A production file system, or PFS, is any typical VNX file system that is being used by an application or user.

Checkpoint

  • A point-in-time view of the PFS. SnapSure uses a combination of live PFS data and saved data to display what the file system looked like at a particular point-in-time. A checkpoint is thus dependent on the PFS and is not a disaster recovery solution. Checkpoints are also known as snapshots.

SavVol

  • Each PFS with a checkpoint has an associated save volume, or SavVol. The first change made to each PFS data block triggers SnapSure to copy that data block to the SavVol.

Bitmap

  • SnapSure maintains a bitmap of every data block in the PFS where it identifies if the data block has changed. Each PFS with a checkpoint has one bitmap that always refer to the most recent checkpoint.

Blockmap

  • A blockmap of the SavVol is maintained to record the address in the SavVol of each saved data block. Each checkpoint has its own blockmap.
..

EMC - VNX2 - Snapshot

1.Usefull Link


2. Overview


VNX Snapshot is a storage system-based software application that allows the user to create snapshots of pool-based LUNs. In fact, VNX Snapshots can only be used with pool LUNs. A snapshot is a virtual point-in-time copy of a LUN and takes only seconds to create. VNX Snapshots use a very different internal mechanism to that used by SnapView snapshots, though both are pointer-based. VNX Snapshot data may be in the original Primary LUN space or may have been written to a different location in the Pool. 
As a result of the Relocate on First Write (ROW) technology used, VNX Snapshots use appreciably less additional space than a full copy would use. A VNX Snapshot will use appreciably less space than that occupied by its Primary LUN, and will make more efficient use of space than SnapView Snapshots. 
An enabler gives the user access to VNX Snapshots, while a separate enabler allows the use of SnapView Snapshot and Clone technology. These two methods of making point-in-time copies are independent, and have limits which are independent of each other. 
They can coexist on the same storage system, and even on the same Pool LUNs. Note that VNX Snapshots cannot be used on Classic LUNs. Management of VNX Snapshots is performed through Unisphere or Navisphere Secure CLI. A host-based utility, SnapCLI, can perform a subset of the VNX Snapshot management operations, and will be discussed later.

The Primary LUN is the production LUN that is replicated. This is the LUN that is in use by the application (and the production host) and it is not visible to secondary hosts. When a snapshot is attached to a snapshot mount point, it is made available to a secondary host.
A Snapshot is the VNX Snapshot equivalent of the SnapView session.
  • A Snapshot Mount Point is the VNX Snapshots equivalent of the SnapView Snapshot – a virtual LUN that is used to make the replica visible to a secondary host. The SMP is associated with the primary LUN, and can be used for snapshots of that LUN only.
  • Consistency Groups allow primary LUNs or Snapshot Mount Points to be grouped together persistently. Operations can be performed on the group as a single object


VNX Snapshots address limitations of copy on first write (COFW) SnapView Snapshots. The VNX Snapshot technology is redirect on write (ROW or ROFW). VNX Snapshots are limited to Pool-based LUNs (i.e. not Classic LUNs). Up to 256 writeable VNX Snapshots can be associated with any Primary LUN, though only 255 are user visible. Because the VNX Snapshot uses pointers rather than a full copy of the LUN, it is space-efficient, and can be created almost instantaneously. The ROW mechanism does not use a read from the Primary LUN as part of its operation, and thus eliminates the most costly (in performance terms) part of the process.

  • A Reserved LUN Pool is not required for VNX Snapshots - VNX Snapshots use space from the same Pool as their Primary LUN. Management options allow limits to be placed on the amount of space used for VNX Snapshots in a Pool.
  • VNX Snapshots allow replicas of replicas; this includes Snapshots of VNX Snapshots, Snapshots of attached VNX Snapshot Mount Points, and Snapshots of VNX Snapshot Consistency Groups. VNX Snapshots can coexist with SnapView snapshots and clones, and are supported by RecoverPoint.
  • If all VNX Snapshots are removed from a Thick LUN, the driver will detect this and begin the defragmentation process. This converts Thick LUN slices back to contiguous 256 MB addresses. The process runs in the background and can take a significant amount of time. The user can not disable this conversion process directly, however, it can be prevented by keeping at least one VNX Snapshot of the Thick LUN.

A VNX Snapshot Mount Point (SMP) is a container that holds SCSI attributes
•WWN
•Name
•Storage Group LUN ID, etc


The VNX Snapshot Consistency Group allows Snapshots to be taken at the same point in time on multiple Primary LUNs. If individual Snapshots were made of the Primary LUNs, it is possible that updates to one or more Primary LUNs could take place between the time of the Snapshot on the first Primary LUN and the time of the Snapshot on the last Primary LUN. This causes inconsistency in the Snapshot data for the set of LUNs. The user can ensure consistency by quiescing the application but this is unacceptable in many environments.

  • A Consistency Group can have a Snapshot taken of it, and can have members added or removed. Restore operations can only be performed on Groups that have the same members as the Snapshot. This may require modifying Group membership prior to a restore.
  • When a Snapshot is made of a Group, updates to all members are held until the operation completes. This has the same effect as a quiesce of the I/O to the members, but is performed on the storage system rather than on the host.
  • VNX Snapshot Set – a group of all Snapshots from all LUNs in a Consistency Group. For simplifications, is referred to as CG Snap throughout the material. VNX Snapshot Family – a group of Snaps from the same Primary LUN

EMC - VNX2 - Snapview Snapshot

1. Usefull Link


2. Overview


VNX SnapView snapshots are a view of the data and not the actual data itself. As a result, creating a Snapshot and starting a session is a very quick process, requiring only a few seconds. The view that is then presented to the secondary host is a frozen copy of the source LUN as the primary host saw it at the time the session was started. The SnapView snapshot is writable by the secondary host, but any changes made to it are discarded if the SnapView snapshot is deactivated.
A SnapView snapshot is a composite of the unchanged data chunks on the source LUN and data chunks on a LUN called “Reserved LUN”. Before chunks of data are written to the source LUN, they are copied to a reserved area in private space, and the memory map is updated with the new location of these chunks. This process is referred to as Copy on First Write. The Copy On First Write Mechanism (COFW) uses pointers to track whether data on the source LUN, or in the Reserved LUN Pool. These pointers are kept in SP memory, which is volatile, and could therefore be lost if the SP should fail or the LUN be trespassed. A SnapView feature designed to prevent this loss of session metadata is persistence for sessions (which stores the pointers on the Reserved LUN(s) for the session). All sessions are automatically persistent and the user cannot turn off persistence.
The SnapView snapshot can be made accessible to a secondary host, but not to the primary host (unless software that allows simultaneous access, like EMC Replication Manager, is used).


A VNX is required hardware for using SnapView snapshots. If a host is to access the SnapView snapshot, two or more hosts are required; one primary host to access the VNX source LUN and one or more additional secondary hosts to access the SnapView snapshot of the source LUN.
The Admsnap program runs on host system in conjunction with SnapView running on the EMC VNX storage processors (SPs), and allows the user to start, activate, deactivate, and stop SnapView sessions. The Admsnap utility is an executable program (Command line) that the user can run interactively or with a script. This utility ships with the SnapView enabler.


The source LUN, the SnapView session, and the reserved LUN work together to create the SnapView snapshot. The SnapView snapshot is made visible to a secondary host when is activated to a SnapView session (given that a SnapView snapshot has been defined and has been added to a storage group connected to the secondary host).


The copy on first write mechanism (COFW) involves saving an original data area from the source LUN into a special save area (Reserved LUN) when that data area on the active LUN is about to be changed. The official term for that data area is a ‘chunk’ – a 64 KB piece of contiguous data.
The chunk is saved only once per session. This ensures that the view of the LUN is consistent and, unless writes are made to the SnapView snapshot, is always a true indication of what the LUN looked like at the time it was snapped (the session was started).
Saving only chunks that have been changed allows efficient use of the disk space available – whereas a full copy of the LUN would use additional space equal in size to the active LUN, a SnapView snapshot may use as little as 20% of the space, on average. This depends greatly, of course, on how long the SnapView snapshot needs to be available and how frequently data changes on the source LUN and the SnapView snapshot.
Saving original blocks also means that SnapView can roll a source LUN back to a previous point in time. This may be useful for fast recovery from corruption of the source LUN.

Due to the dynamic nature of reserved LUN assignment per source LUN, it may be better to have many smaller LUNs that can be used as a pool of individual resources. A limiting factor here is that the total number of reserved LUNs allowed varies by storage system model.
  • Each reserved LUN can be a different size, and allocation to source LUNs is based on which is the next available reserved LUN, without regard to size. This means that there is no mechanism to ensure that a specified reserved LUN will be allocated to a specified source LUN. Because of the dynamic nature of the SnapView environment, assignment may be regarded as a random event (though, in fact, there are rules governing the assignment of reserved LUNs).
  • The Reserved LUN Pool can be configured with thick pool LUNs or classic LUNs only. Pool LUNs that are created as Thin LUNs cannot be used in the RLP.
  • The combination of these factors makes the sizing of the reserved LUN pool a non-trivial task – particularly when Incremental SAN Copy and MirrorView/A are used along with Snapshots.
  • It is expected that 10% of the data on the source LUN changes while the session is active. Creating 2 RLs per Source LUN allows for a safety margin - it allows twice the expected size, for a total of 20%.
  • This example shows a total of 160 GB to be snapped, with eight reserved LUNs totaling 32 GB.
  • The user may obtain reserved LUN pool statistics by viewing the properties of the reserved LUN pool. At-a-glance information presented includes the amount of space used and the amount of free space. Warnings about LUN pool usage are available in the SP Event Log and may also be available elsewhere, if configured by the user. Some performance related information, of the type available from Unisphere Analyzer, may be accessed from the GUI.
  • Once the LUN Pool has been populated, a next step is to flag all required LUNs as Snapshot source LUNs. This is performed by creating snapshots of those LUNs, or starting sessions on those LUNs, which changes the LUN state from a regular LUN to a Snapshot Source LUN. The changed state is stored on the PSM LUN, so that it survives power cycles. Destruction of the SnapView snapshots and sessions associated with a source LUN return it to ‘standard’ LUN status and that change is also recorded on the PSM LUN. Here the source LUN returns to the regular LUN state.
Note that the calculation shown here is a compromise. Different results are obtained if the goal is to minimize the number of reserved LUNs or to minimize the wasted space in the reserved LUN pool. Also note that the Snapshot Wizard creates larger reserved LUNs by default. It is dealing with a potentially less-experienced user and leaves more overhead for safety.


Here we see the different host I/O types that may be directed at a Snapshot. Note that if there is no active session on the Snapshot, it appears off-line to the host, and the host operating system raises an error if an attempt is made to access it.
If a session is active, the SnapView driver needs to perform additional processing. Reads may require data to be read from the reserved LUN pool or the source LUN, and the driver needs to consult the memory map to determine where the data chunks are located and retrieve them.
Writes to a Snapshot are always directed at the reserved LUN pool because the secondary host has no access to the source LUN. The driver needs to determine whether the data chunk is already in the Reserved LUN Pool or not. If it is, the write proceeds. If it is not, the chunk is copied to the reserved LUN pool and the write performed on that chunk. The chunk is copied into SP memory, the write data merged with the chunk, and the modified chunk written to the reserved LUN Pool

use SnapView snapshots, the user must create a Reserved LUN Pool. This LUN pool needs enough available space to hold all the original chunks on the source LUN that are likely to change while the session is active.
When the user starts the first session on a source LUN, one reserved LUN is assigned (allocated) to that source LUN. If the reserved LUN becomes full during the time this session is running, the next available reserved LUN will be assigned automatically to the source LUN. When the session is started, the COFW mechanism is enabled and the SnapView starts tracking the source LUN.

Creating the SnapView snapshot enables the allocation of an offline device (Virtual LUN) to a storage group. Following the slide the user creates the SnapView snapshot that will be offline until activated to a running SnapView session.
Snapshot of Source Lun is added to the Storage Group of Server B the device is still offline (Not Ready) as the SnapView Snapshot is not activated yet.

Once the SnapView session and the SnapView snapshot are created for a given source LUN, the user can activate the SnapView snapshot. This action essentially associates a Snapview snapshot to the point-in-time view provided by the SnapView session. If the SnapView snapshot is already in a storage group and allocated to a host, following activation the connected host should be able to see this point-in-time copy of source LUN data after a bus rescan at the host level.
If the secondary host requests a read, SnapView first determines whether the required data is on the source LUN (i.e. has not been modified since the session started), or in the reserved LUN Pool, and fetches it from the relevant location

COFW process, invoked when a host changes a source LUN chunk for the first time. The original chunk is copied to the reserved LUN Pool.

After the copy of the original chunk to the reserved LUN Pool, pointers are updated to indicate that the chunk is now present in the reserved LUN Pool. The map in SP memory, and the map on disk (remember that all sessions are persistent), is also updated.
Note that once a chunk has been copied to the reserved LUN Pool, further changes made to that chunk on the source LUN (for the specific session) do not initiate any COFW operations for that session

SnapView Snapshots are writeable by the secondary host. This slide shows the write operation from Server B. The write operation addresses a non-virgin chunk; no data for that chunk is in the reserved LUN Pool. SnapView copies the chunk from the source LUN to the reserved LUN Pool in an operation which may be thought of as a Copy on First Write. The copy of the data visible to the Server B(the copy in the RLP) is then modified by the write

After the modification of the chunk, the map and pointers are updated