Unisphere Remote is a centralized and easy-to-use application that centrally monitors VNX and VNXe systems.
Unisphere Remote enables you to:
Unisphere Remote enables you to:
- • Monitor hundreds of VNX and VNXe systems from a single interface
- • View aggregated alerts, capacity, CPU usage, and the health of multiple systems
- • Control access to the monitoring interface by setting up local Unisphere Remote users or integrating existing Lightweight Directory Access Protocol (LDAP) enabled users and groups
- • Organize logical views of the VNX and VNXe nodes (e.g. by location, type, or department)
- • Launch Unisphere for individual VNX and VNXe systems
The Unisphere Remote environment consists of a Unisphere Remote server running in a VMware virtualized environment, multiple VNX and/or VNXe systems, and a remote system to access the Unisphere Remote server
Latest release of Unisphere Remote, it has been renamed Unisphere Central
Open Management Settings
- 1. Hover over the Settings tab from the top menu bar
- 2. Click Management Settings

Configure Network Settings
- 1. Select the Network tab to configure NTP and DNS settings
- 2. In the Time Servers (NTP ) section, select the IP Address radio button and type in 192.168.1.10 and click Add
- 3. In the DNS Servers section, type in 192.168.1.10 for the DNS Server and type vlab.local for the Domain Name and click Add
- 4. Click Apply Changes when done

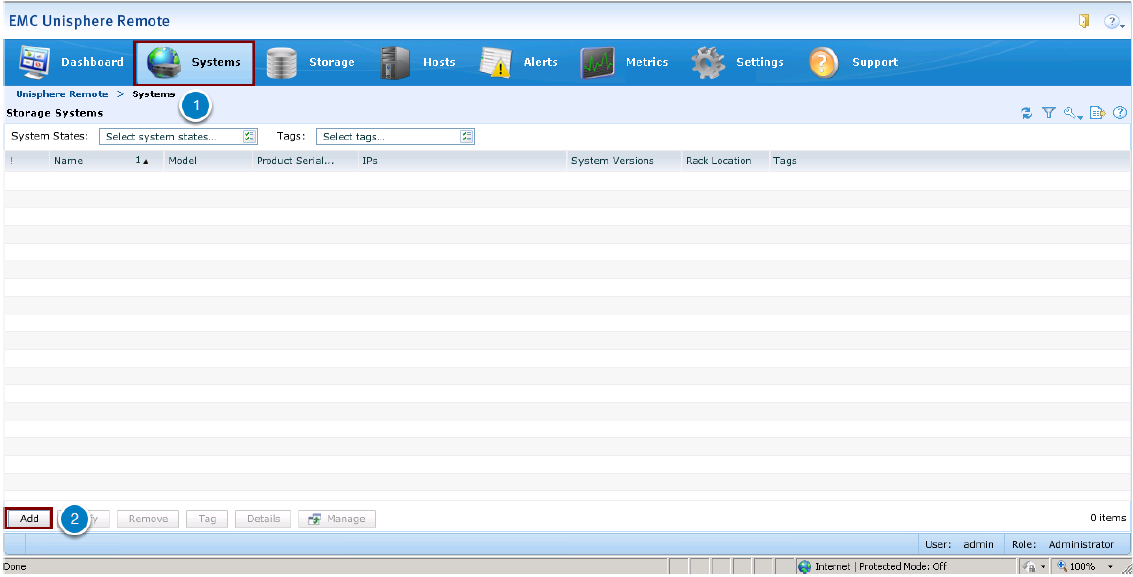
Add a Storage System
This section details adding a storage system to Unisphere Remote for monitoring. Multiple systems can be administered from this one console by adding them to Unisphere Remote. Configure the VNX2 to be Monitored
This section details adding a storage system to Unisphere Remote for monitoring. Multiple systems can be administered from this one console by adding them to Unisphere Remote. Configure the VNX2 to be Monitored
- 1. Click the Systems tab
- 2. Click Add to add a new storage system to be monitored by Unisphere Remote
Customize Link
- 1. Click on the Dashboard tab
- 2. Click the Customize link
- 3. The Dashboard tab can be configured to display multiple dashboards containing any combination of widgets.
These widgets include:
- • Alerts
- • Systems List
- • Capacity
- • Systems Available Size
- • Pools Available Size
- • Metrics Storage

Alerting
The Alerts tab provides a list of storage system issues that you can resolve by performing the steps provided by the alert. You can use alerts to determine the cause of an issue, symptoms of an issue, and the actions that you can take to resolve it. The Alerts tab displays the following information for each alert:
The Alerts tab provides a list of storage system issues that you can resolve by performing the steps provided by the alert. You can use alerts to determine the cause of an issue, symptoms of an issue, and the actions that you can take to resolve it. The Alerts tab displays the following information for each alert:
- • Severity
- • Time
- • Source
- • Type
- • Message
Note that the alerts listed are intentionally inserted into this lab for demonstration purposes.
Navigate to the Alerts Tab
Navigate to the Alerts Tab
- 1. Click the Alerts tab from the top menu bar. You can see a list of alerts for the monitored systems
- 2. Select one of the alerts in the list
- 3. View the description in the Alert Information section at the bottom of the page where you can see details of the alert and any recommended actions

View Storage System Details Page
The Storage System Details page contains two sections. The top half of the page contains system details and capacity usage. The details include:
The Storage System Details page contains two sections. The top half of the page contains system details and capacity usage. The details include:
- • System State
- • Name
- • Model
- • Block Software Version
- • File Software Version
- • Tags
There is also a pie chart showing the current storage utilization of the specific storage system

No comments:
Post a Comment